Collect data from your devices, labs, forms and files. Turn movement video and MRI into numbers. Read it person by person or as a group, ask Smarter AI, shape the platform to your protocol, and see what to do next. Everything on this page works on every plan, Free included, within its limits — unless it carries a plan badge or an In development label.
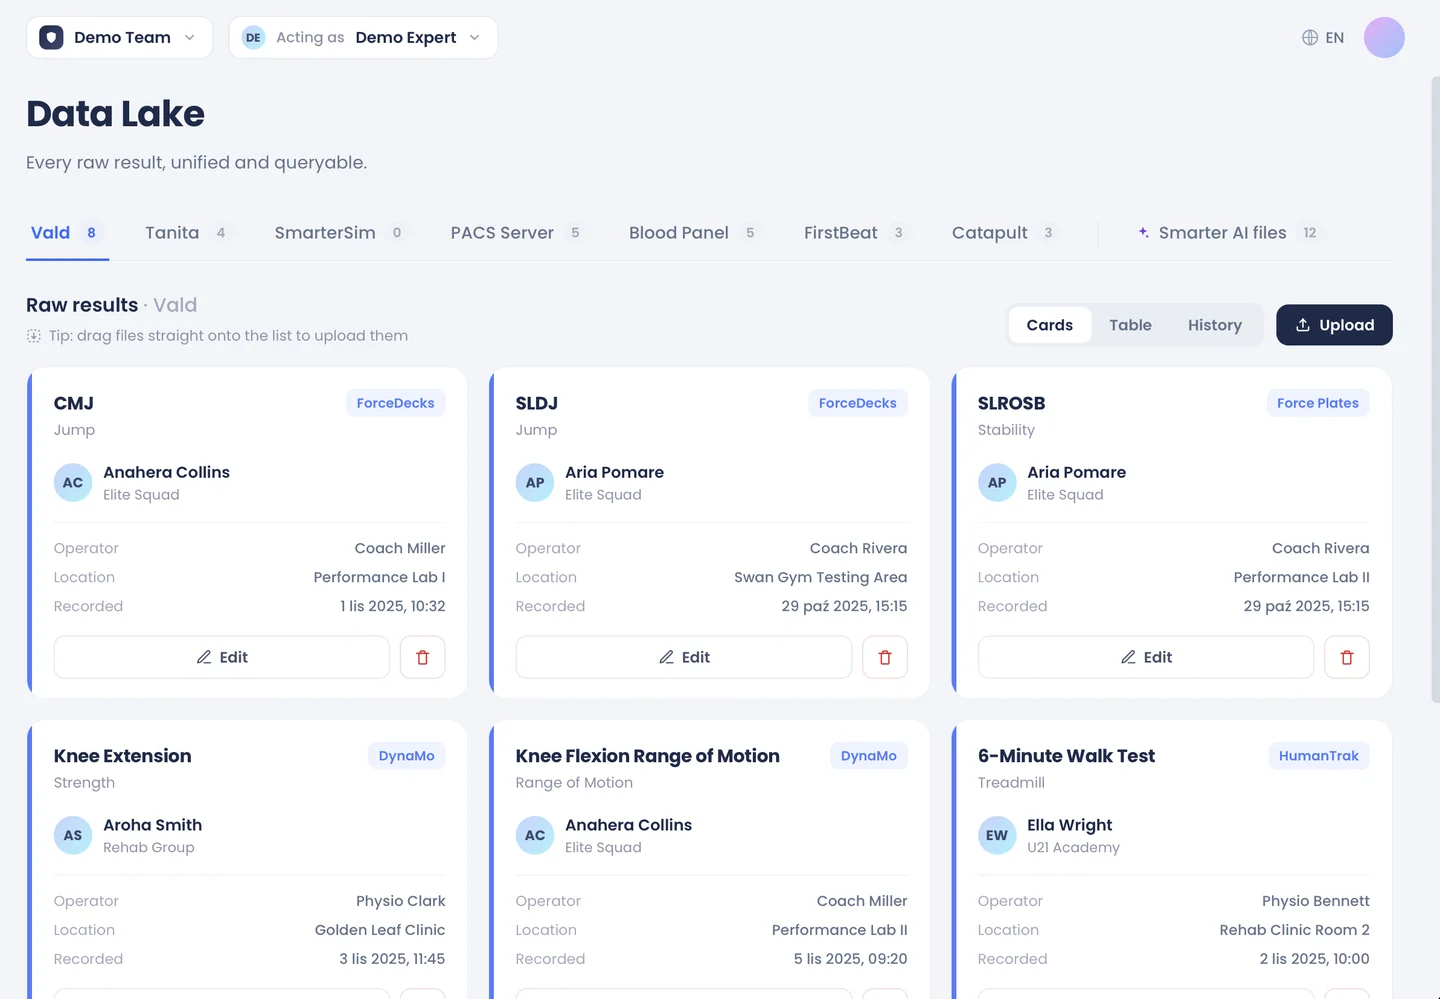
Connect a device once and it keeps syncing, or drop a file into Smarter AI the way you would in any AI chat. Forms and visits cover what you collect yourself. All of it lands in one record per person.
Connect once — new results arrive by themselves.
Integrations are optional: they automate the sources you already use. Switch one on in the platform and new results land in the right person’s record, with no exports and no uploads.
Up to 3 integrations on Free and Core, 10 on Pro, unlimited on Premium.
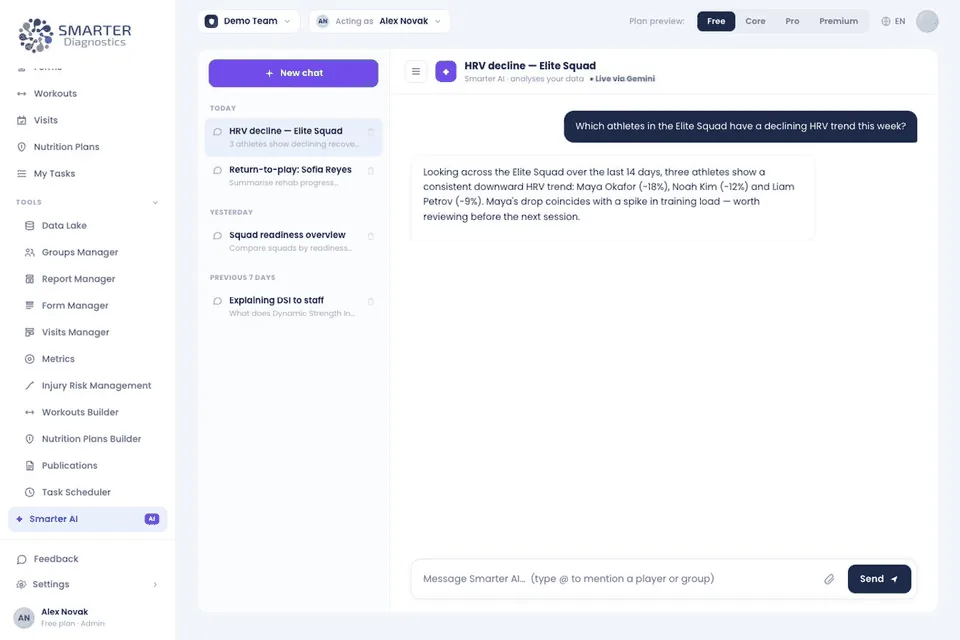
Like any AI chat — except everything lands in the record.
Drag a lab PDF, a movement video, a report or a spreadsheet into the conversation. Smarter AI reads it, and the data lands in the Data Lake under the person it belongs to, next to everything that came in from your integrations.
Every raw result keeps its source — who recorded it, where and when. Where two sources disagree, you see both and choose.
Every plan.
Questionnaires that come back by themselves.
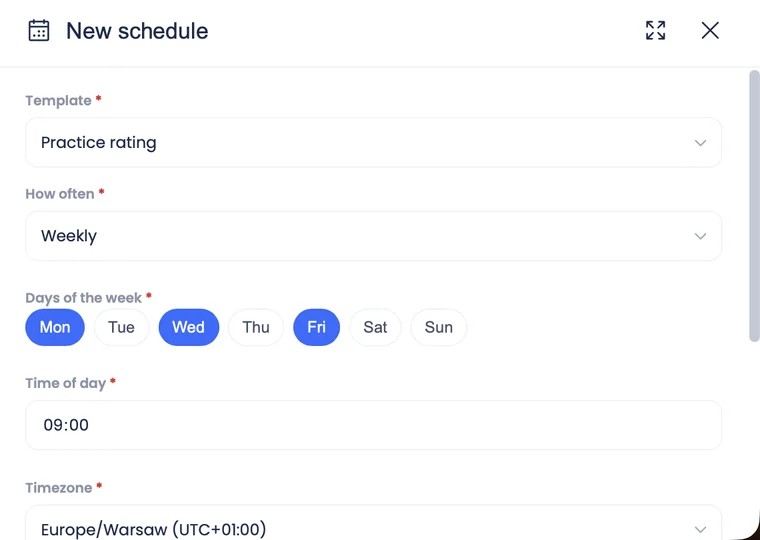
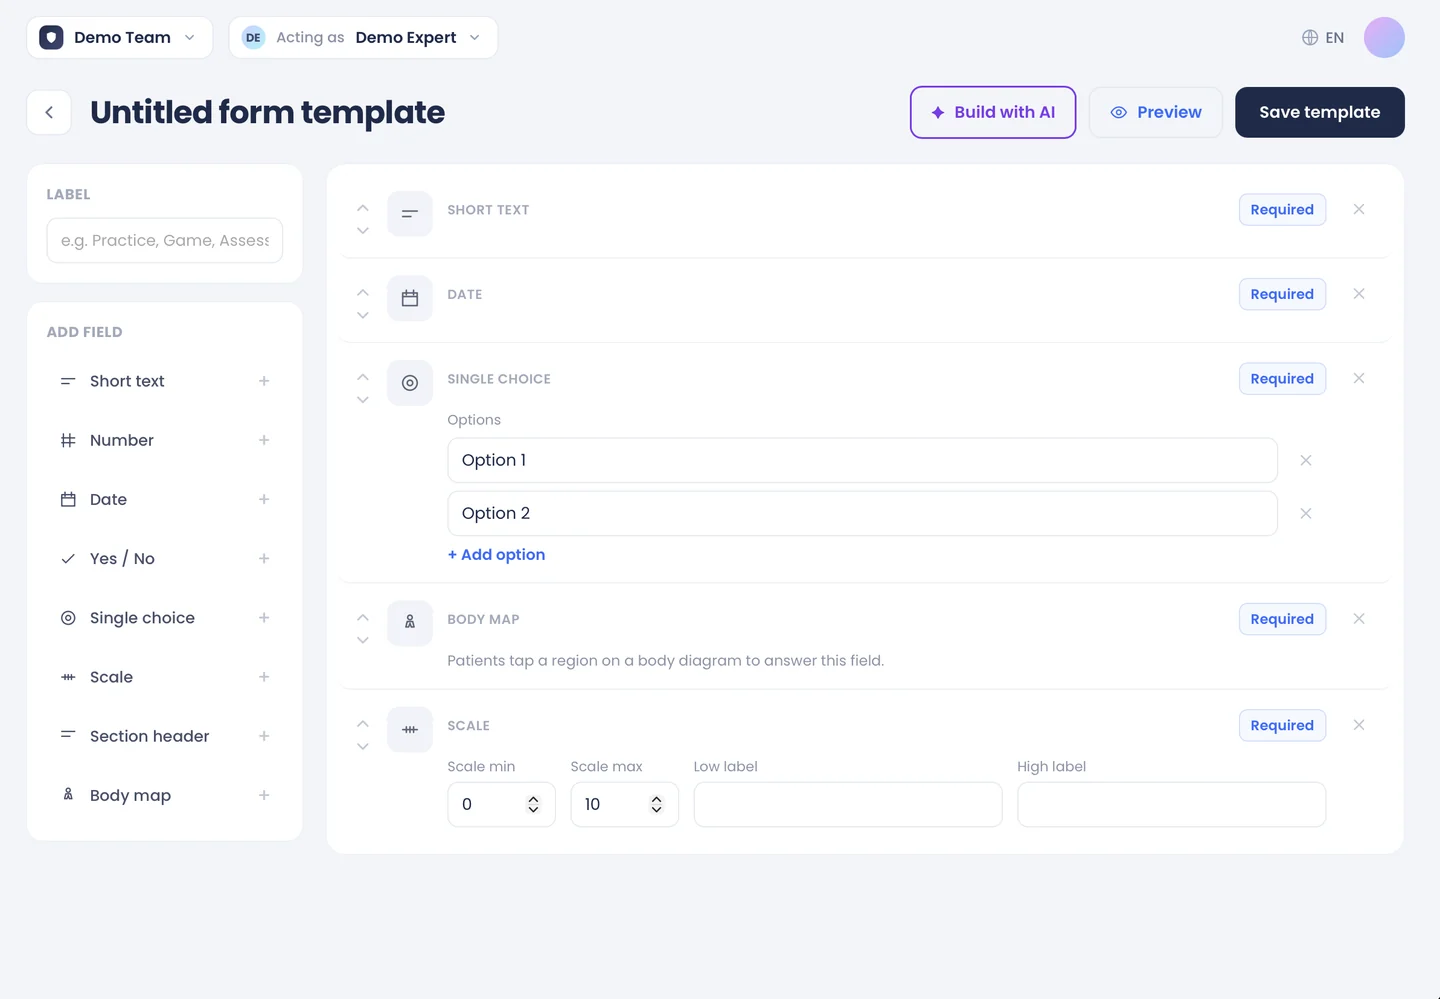
Build a form from ready fields — short text, number, date, yes/no, single choice, scale, body map, section headers — or describe it and let Smarter AI build it. Send it once or on a schedule to people or groups; answers come back from each person’s phone and land in the record.
Every plan.
Your consultation, in your template.
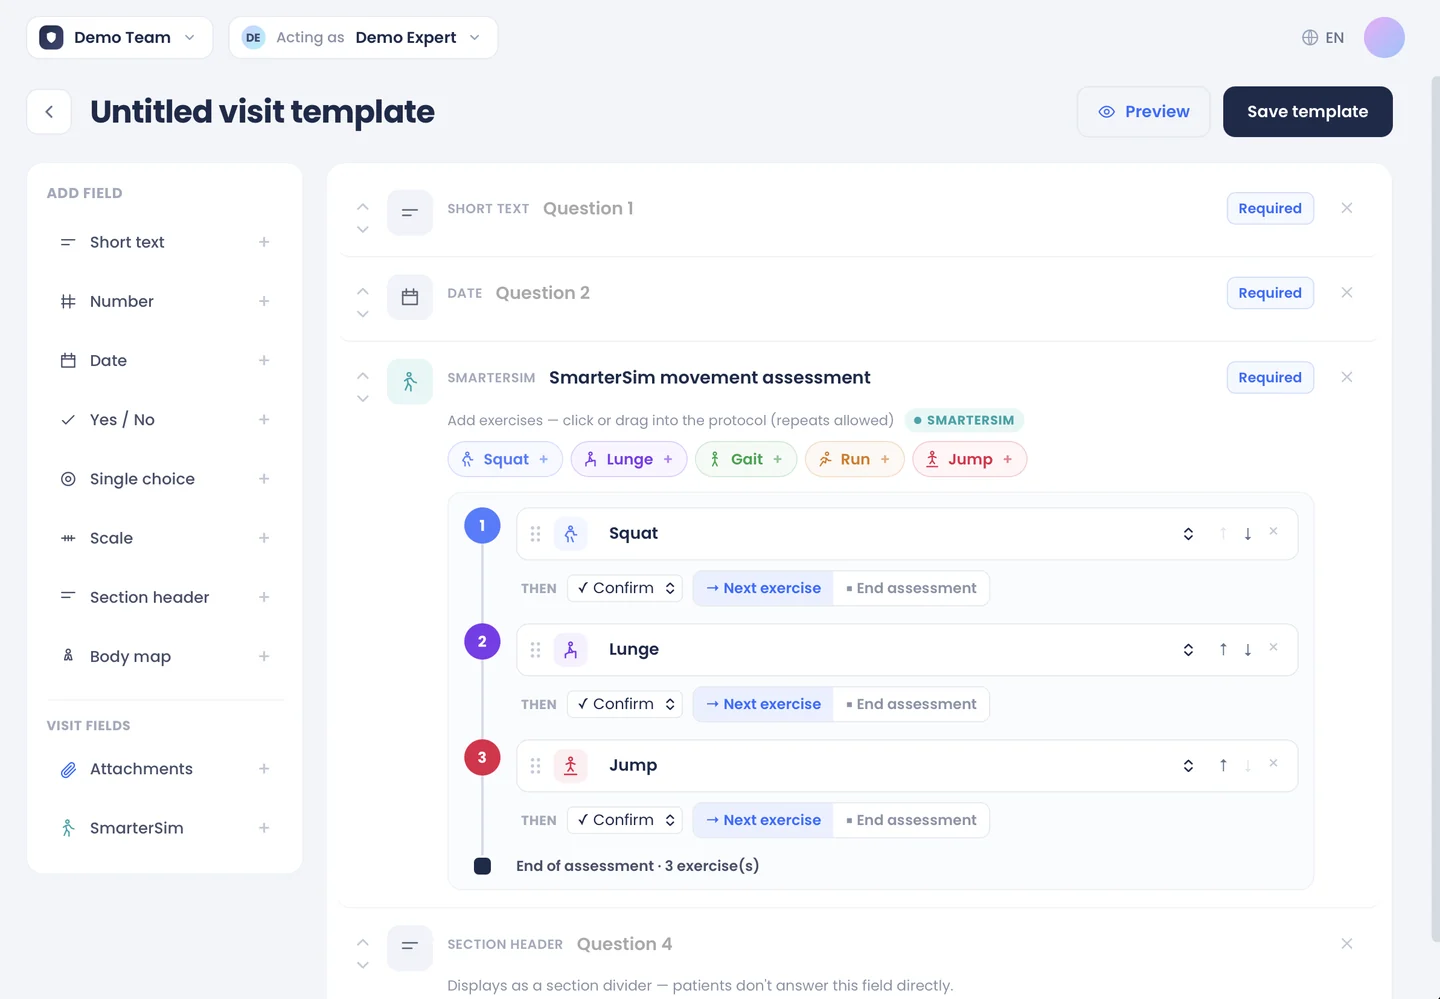
Build a template once and fill it in during the visit: your own fields, attached files, and measurements and data from your sources — a SmarterSim movement assessment, for example. Each visit becomes part of the person’s history.
Every plan.
Don’t see your device? New integrations are days of work, not quarters. Tell us what you run →
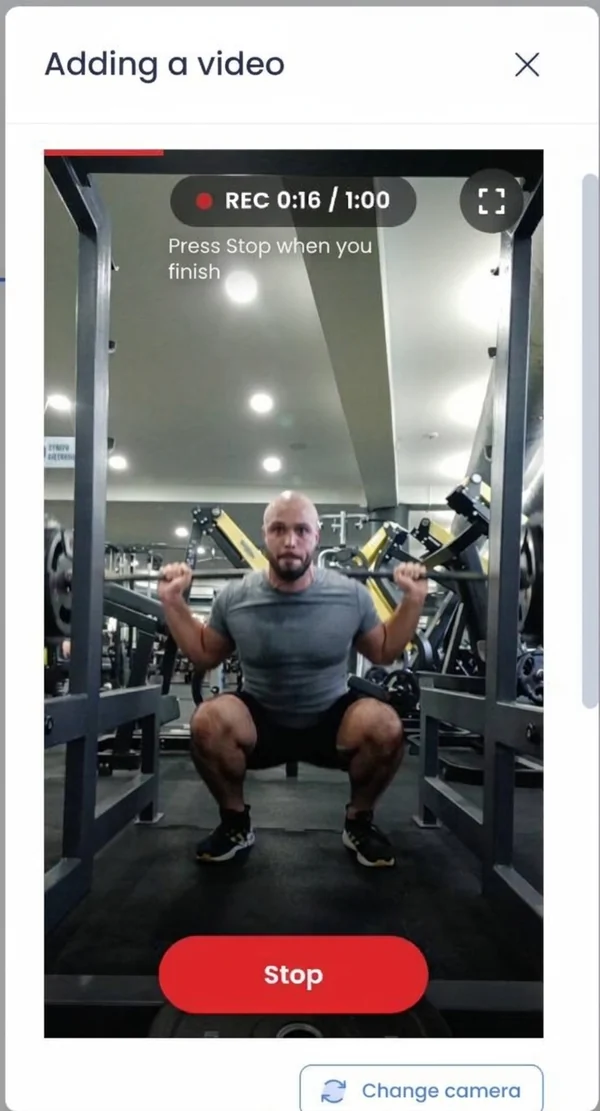
Most data arrives as numbers. Movement and tissue don’t — they arrive as a video and an MRI scan. SmarterSim and SmarterMRI turn those images into biomarkers, and everything else in the platform reads them: reports, group analytics, Smarter AI and recommendations.
One camera, a full movement analysis.
A library of algorithms that turns an ordinary phone video into joint-by-joint numbers — markerless motion capture from a single camera.
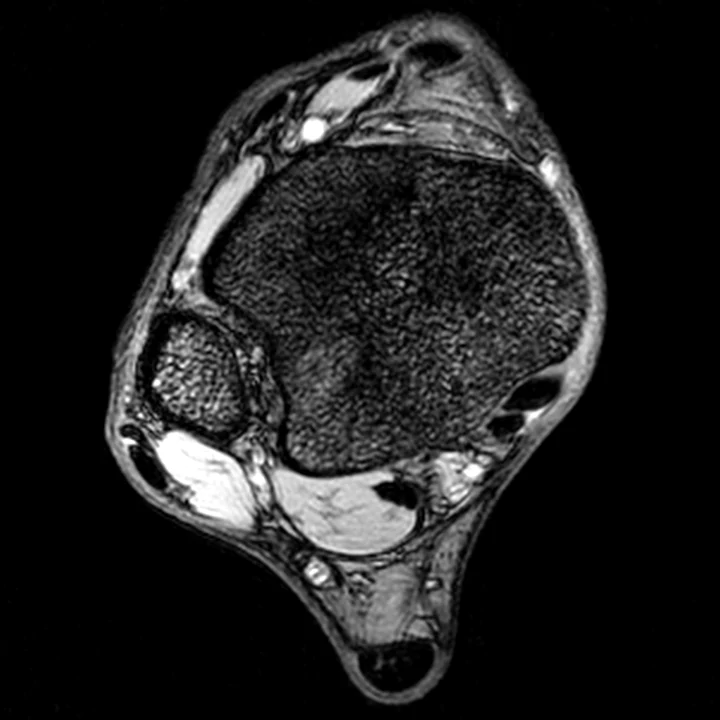
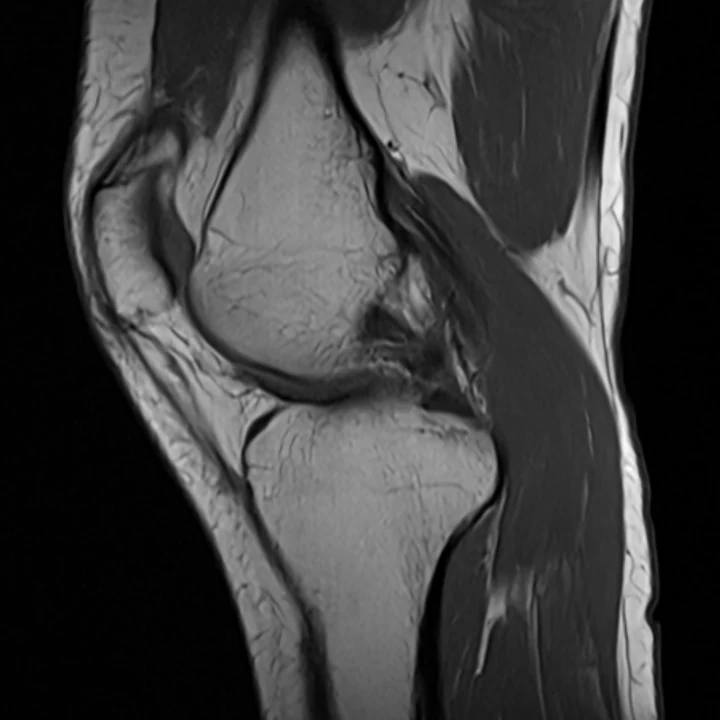
An MRI scan, turned into numbers that describe the tissue.
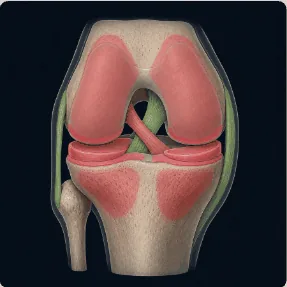
AI models for automated analysis of ankle and knee MRI. They assess the structures and changes most often assessed in these joints, and where they are — the way a radiologist’s report is structured — and translate them into numbers that describe the state of the tissue: structural biomarkers that reports, analytics and recommendations use. Trained on more than 30,000 images, built with the radiologists who read this data.
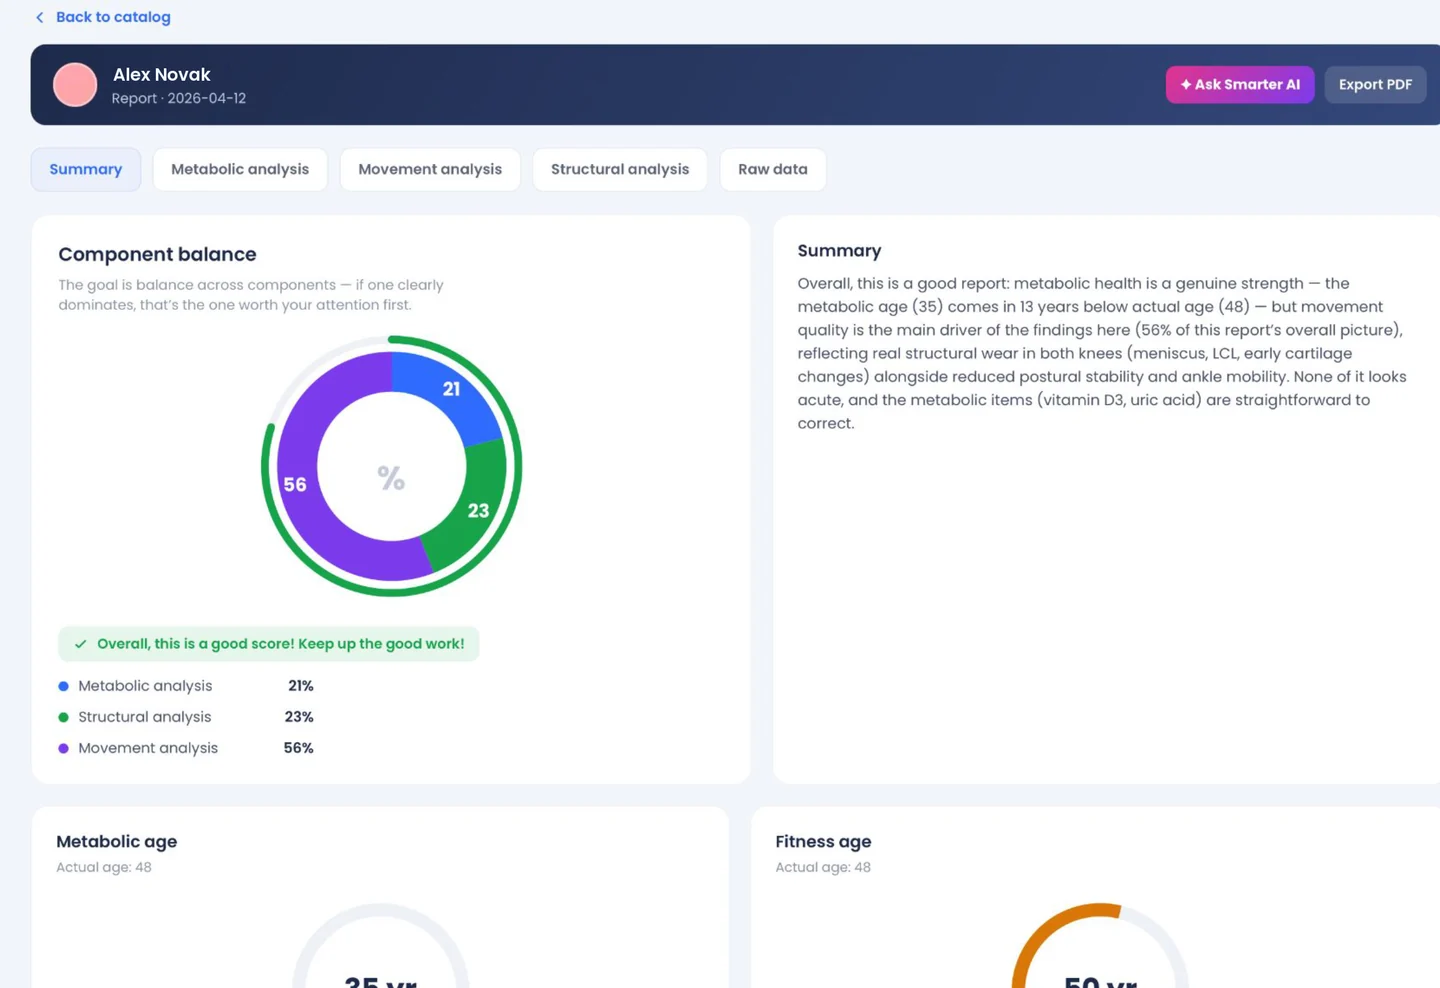
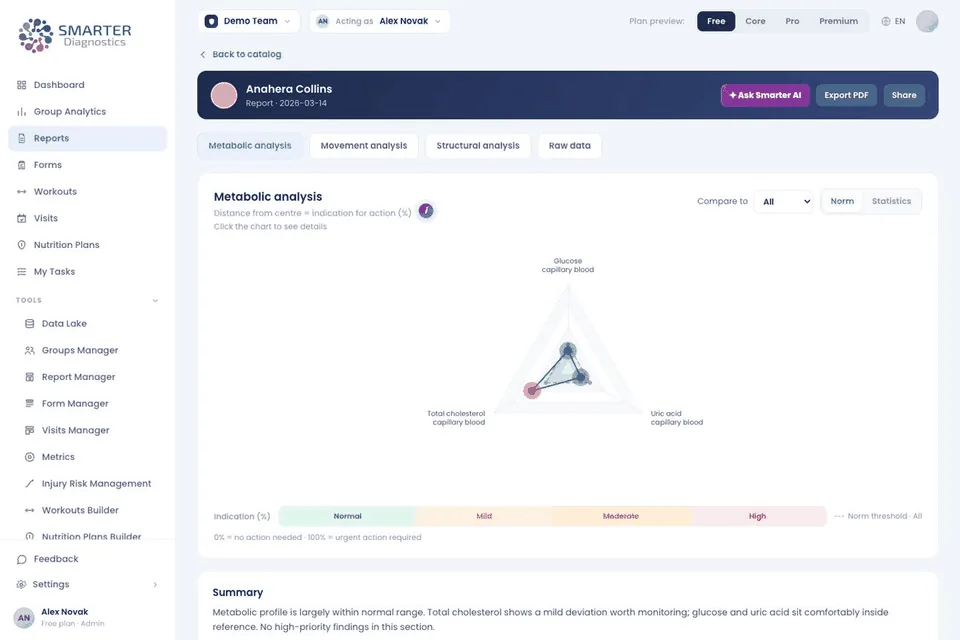
One report per person, across every area their data covers.
Metabolic, movement and structural analysis side by side, with metabolic age and fitness age, the balance between components and a written summary of what matters most — compared with the person’s own history and a matched reference group.
Every plan.
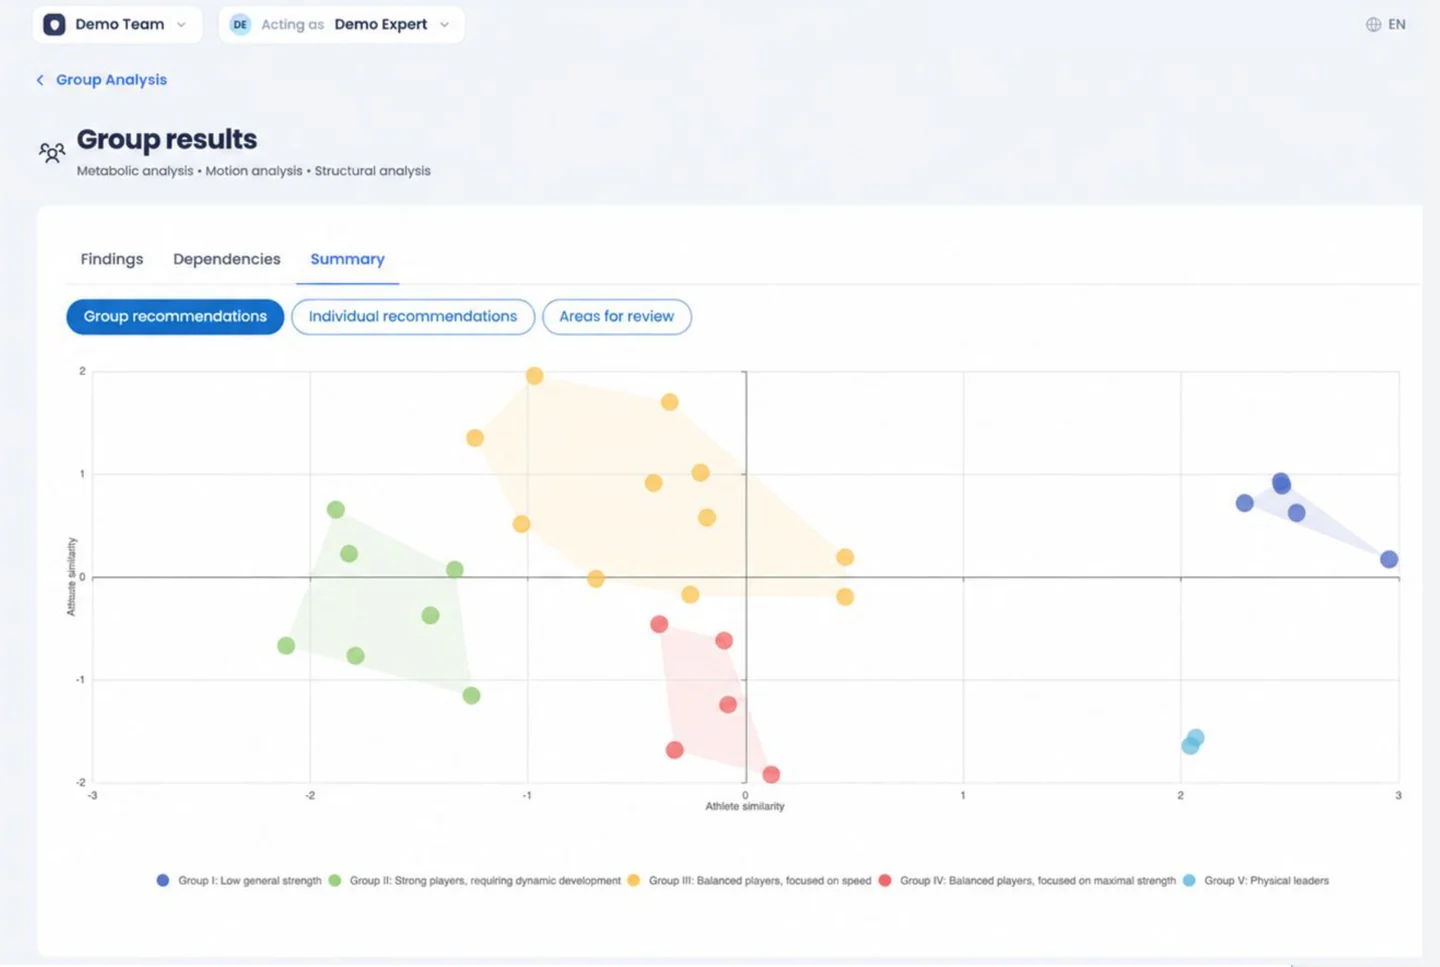
The same report, for a team, a cohort or a program.
Findings, dependencies and a summary across the group, and named clusters — people who need the same thing — each with group recommendations, individual recommendations and areas for review.
Every plan, Free included.
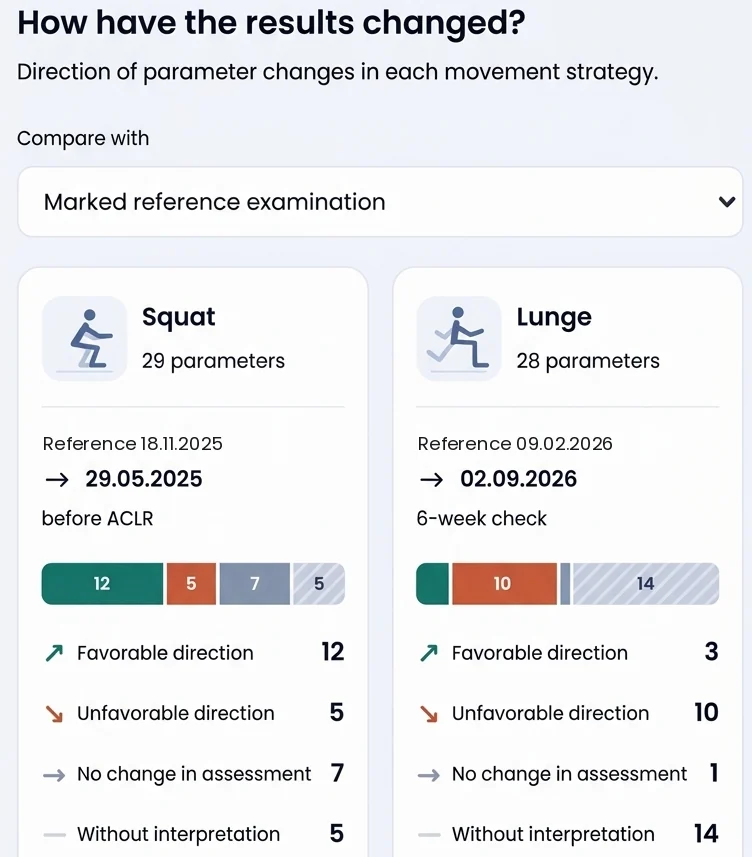
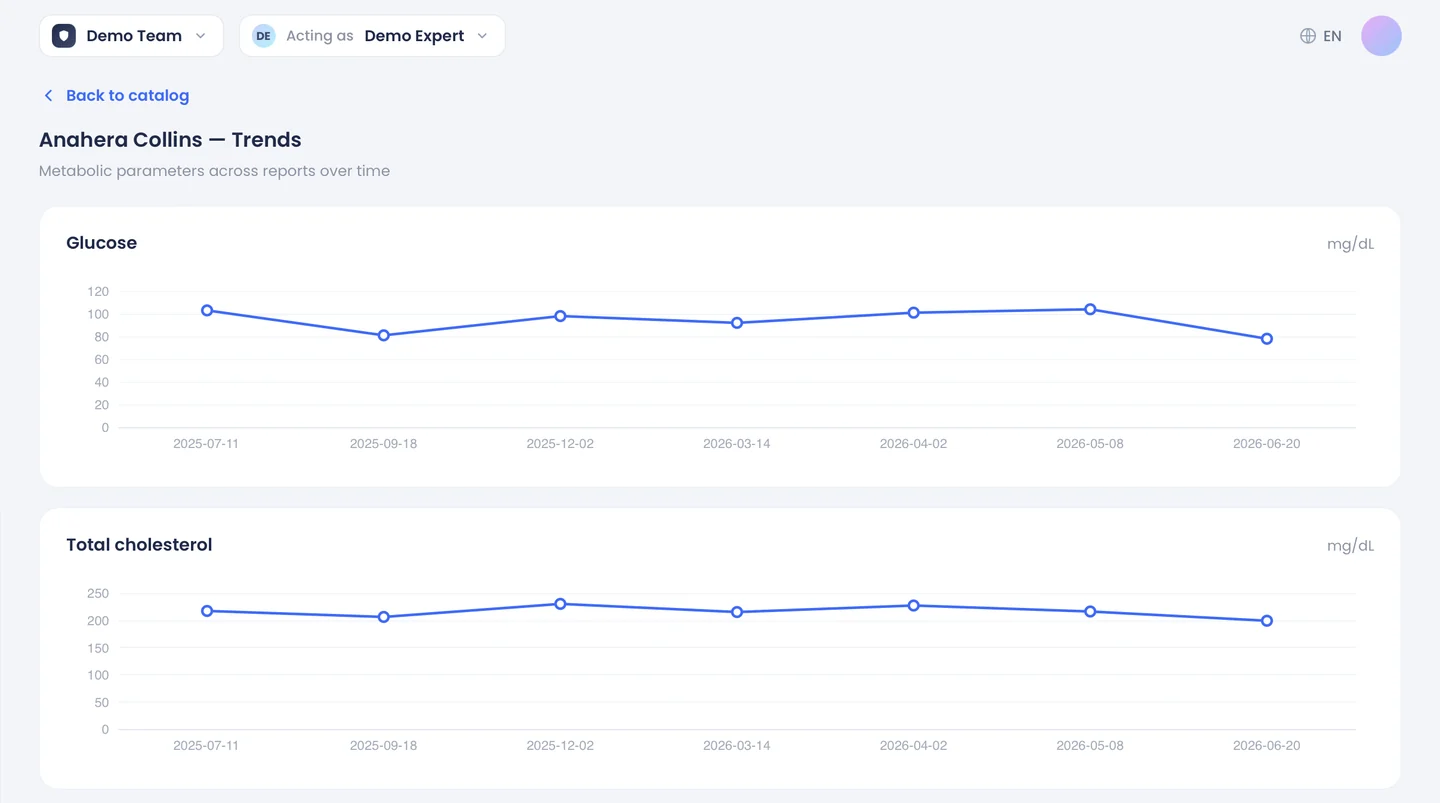
See where each parameter is heading, not just where it is.
Every parameter on one person’s timeline, across all their reports — glucose, cholesterol, jump height, joint angles. Compare any examination with a marked reference one and see which parameters moved in a favorable direction, which in an unfavorable one, and which didn’t change.
Every plan.
Changes reach you without opening a report.
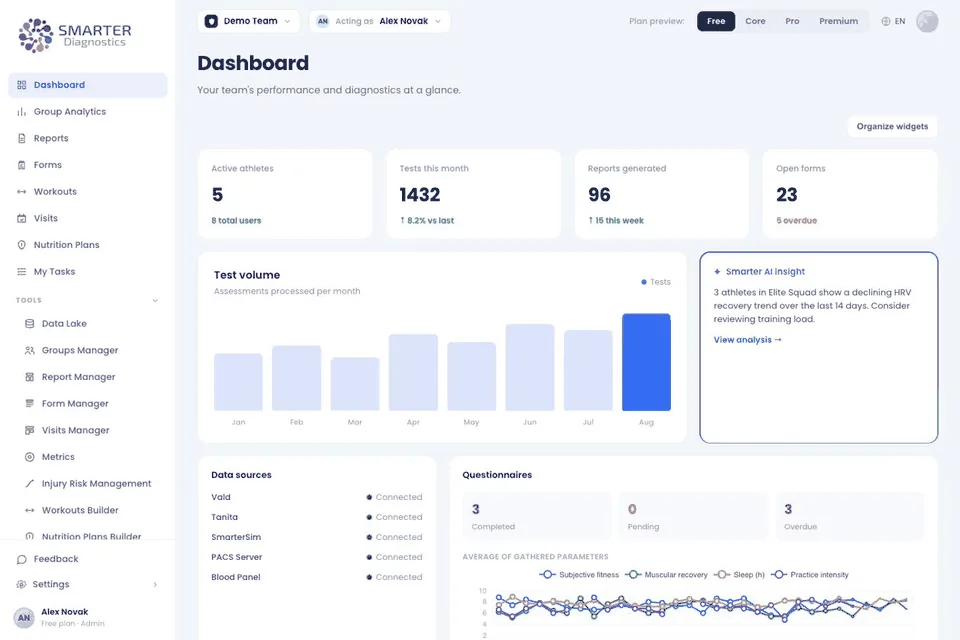
Built from widgets for each role — test volume, data sources, questionnaire trends, Smarter AI insights. Automated summaries and reminders arrive on a schedule, and any report can be shared as a link.
Every plan.
Smarter AI has structured access to your workspace — records, reports, forms and dashboards. Start in the conversation, or from the Ask Smarter AI button wherever you are in the platform; the question then starts from what you were looking at.
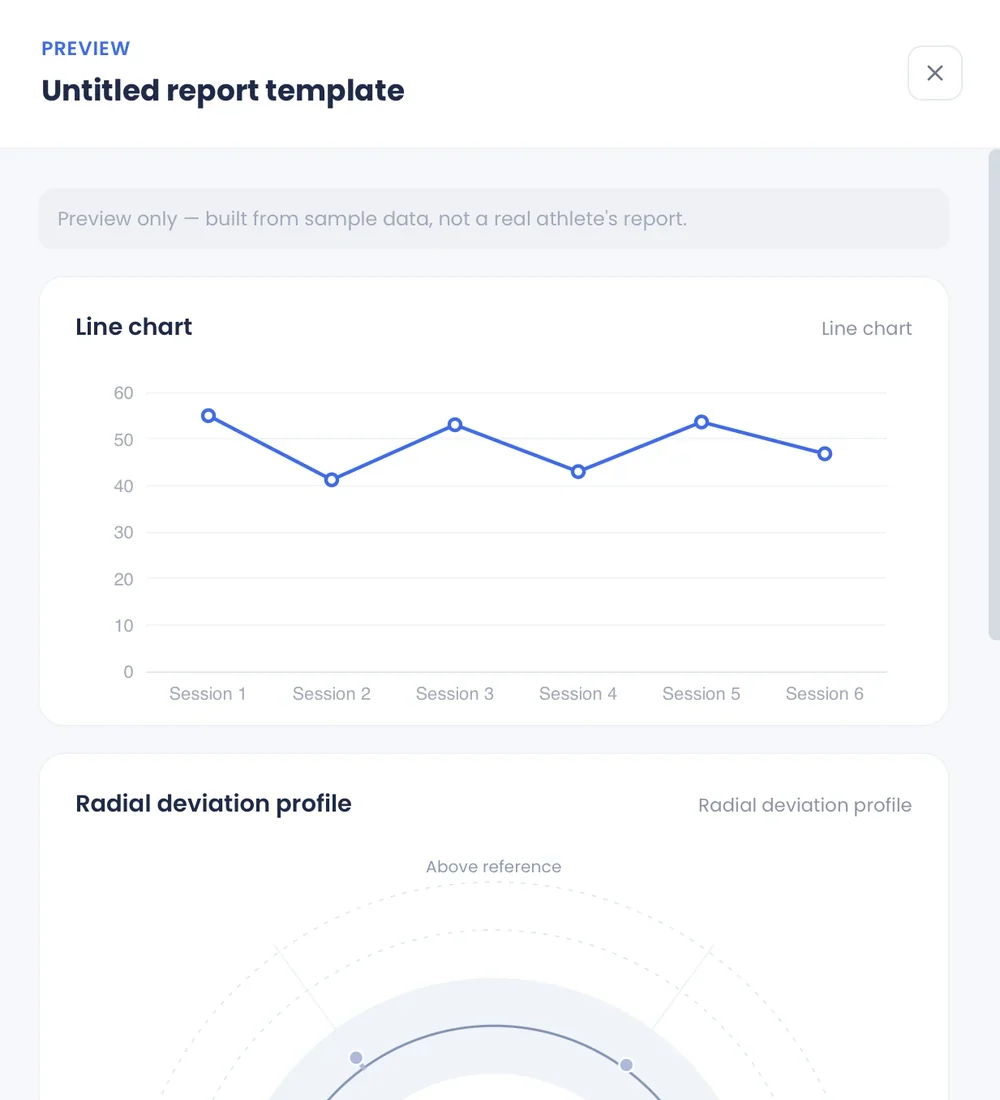
Design the report you would otherwise write by hand.
Drag widgets onto the canvas — radar plot, line chart, column chart, donut chart, radial deviation profile — arrange them in sections and tabs, and preview the result on sample data before anyone sees a real report. Templates can run in more than one language.
Every plan.
Your measures, computed for you.
Combine any measurements into an indicator — the way BMI combines height and weight — with its own history, ranges and comparisons. Use it in reports and groups.
Squads, cohorts, rehab groups, programs.
Set up once in the Groups Manager and used everywhere — in reports, analytics, forms and Smarter AI.
Several organizations, one login.
Each workspace has its own data, plan and logo.
Premium Your logo and icon replace ours in the platform.
This part works today, on every plan:
From the report to the next session.
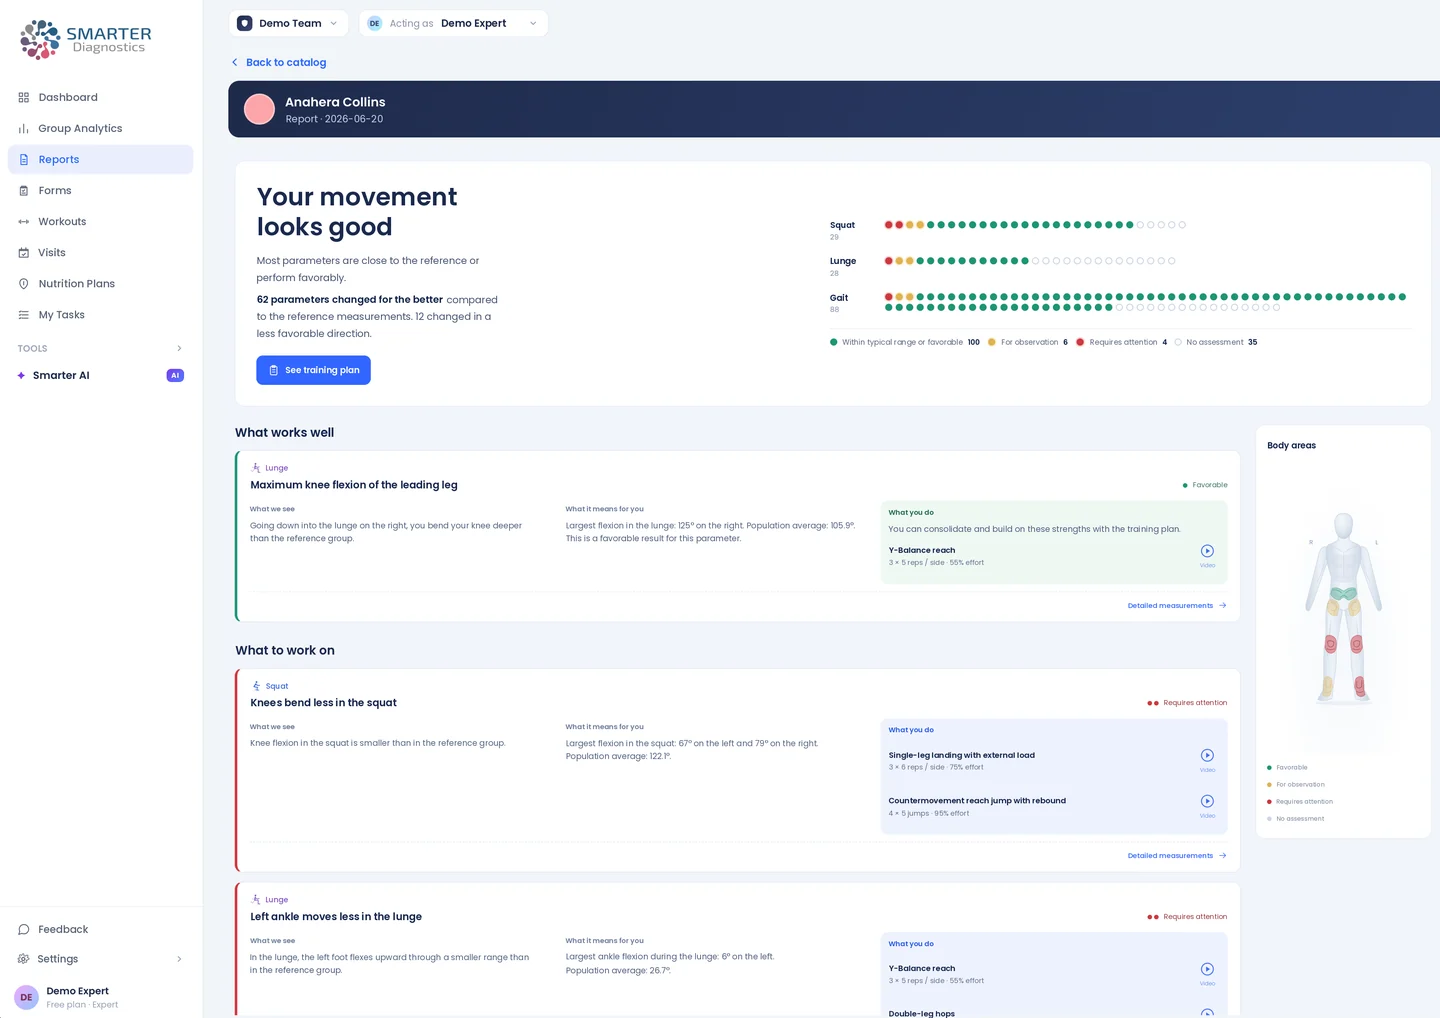
A recommendation down to individual exercises with sets, reps and effort — from Smarter AI, or as the report’s summary. The version written for the person spells out what we see, what it means for them and what to do, with video.
Your specialist edits it before it goes out.
Every plan.
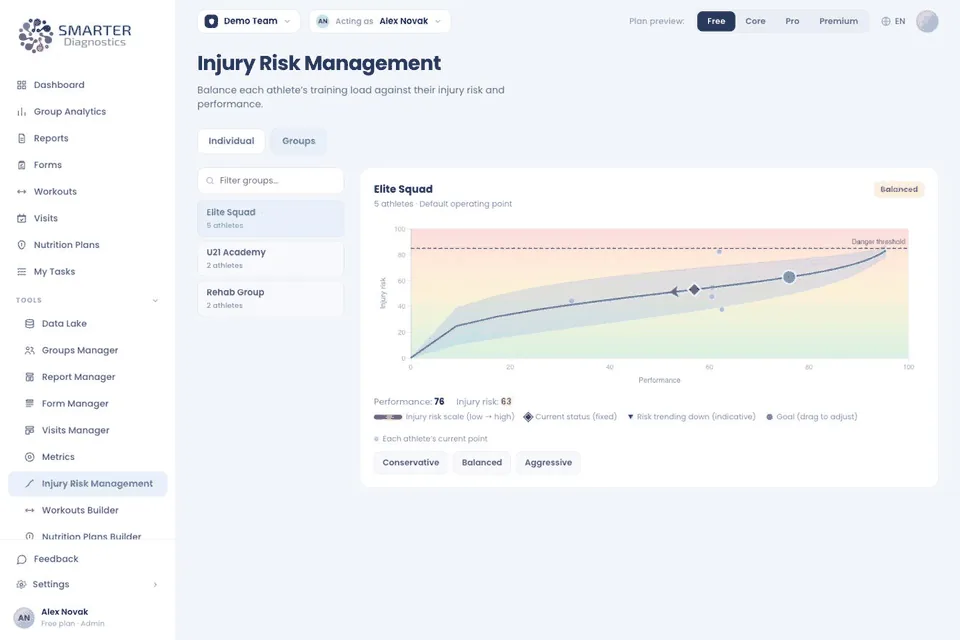
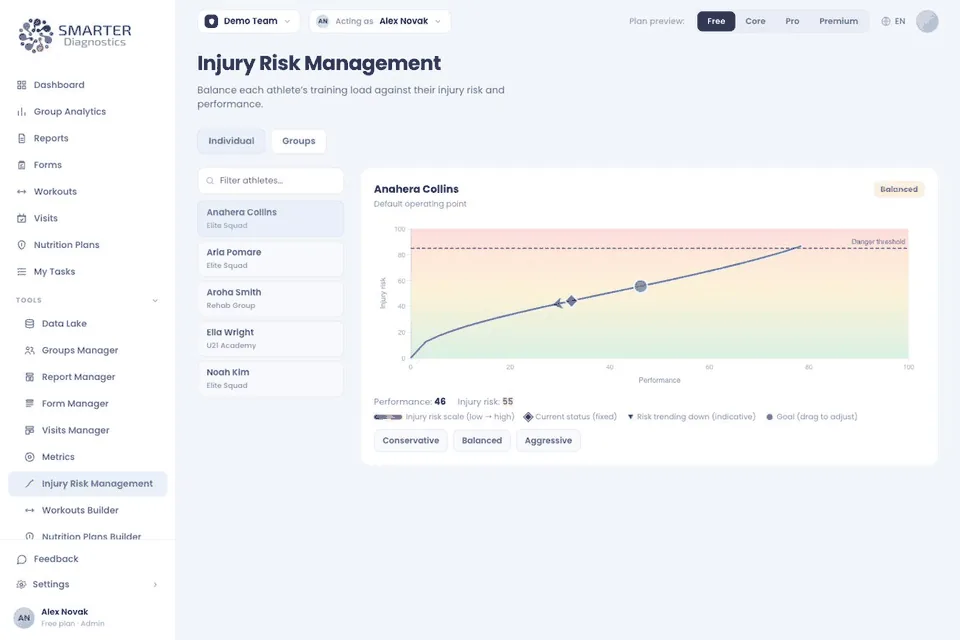
Performance and risk on one curve, for the squad and for one person. You choose the posture — conservative, balanced or aggressive.
On historical data from top football and basketball clubs, the approach identified elevated risk ahead of the event in roughly one in five Achilles ruptures.
Smarter Performance supports decisions made by qualified professionals. It does not replace clinical judgment, and is not currently certified as a medical device.